I was surprised too. There’s a lot of food waste in food commercial hubs there, and there are accurate numbers for that. This mentions household waste, but I doubt they have any numbers for that in Brazil (and much of anywhere else, really). So I’m guessing that’s whatever numbers they can get on food waste.


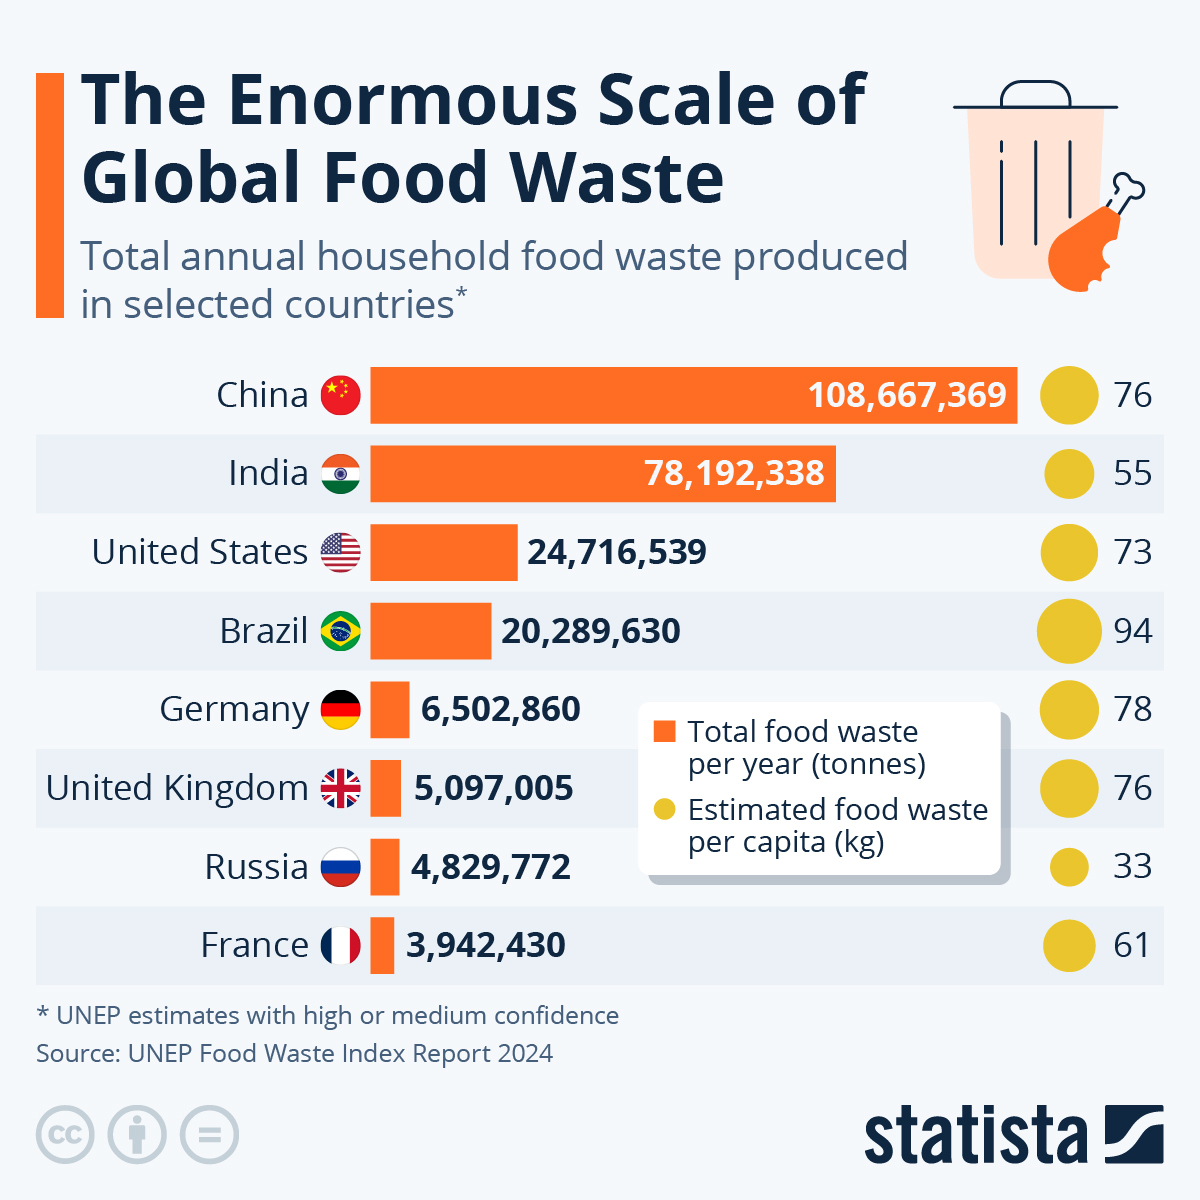
It’s a population chart…
Per-capita figures are on the right. I think this metric should be given the bar chart.
The more useful bit is the “per capital” data on the right side.
Brazil being so high is surprising to me
Russia being so low makes sense and is a bit sad
I was surprised too. There’s a lot of food waste in food commercial hubs there, and there are accurate numbers for that. This mentions household waste, but I doubt they have any numbers for that in Brazil (and much of anywhere else, really). So I’m guessing that’s whatever numbers they can get on food waste.