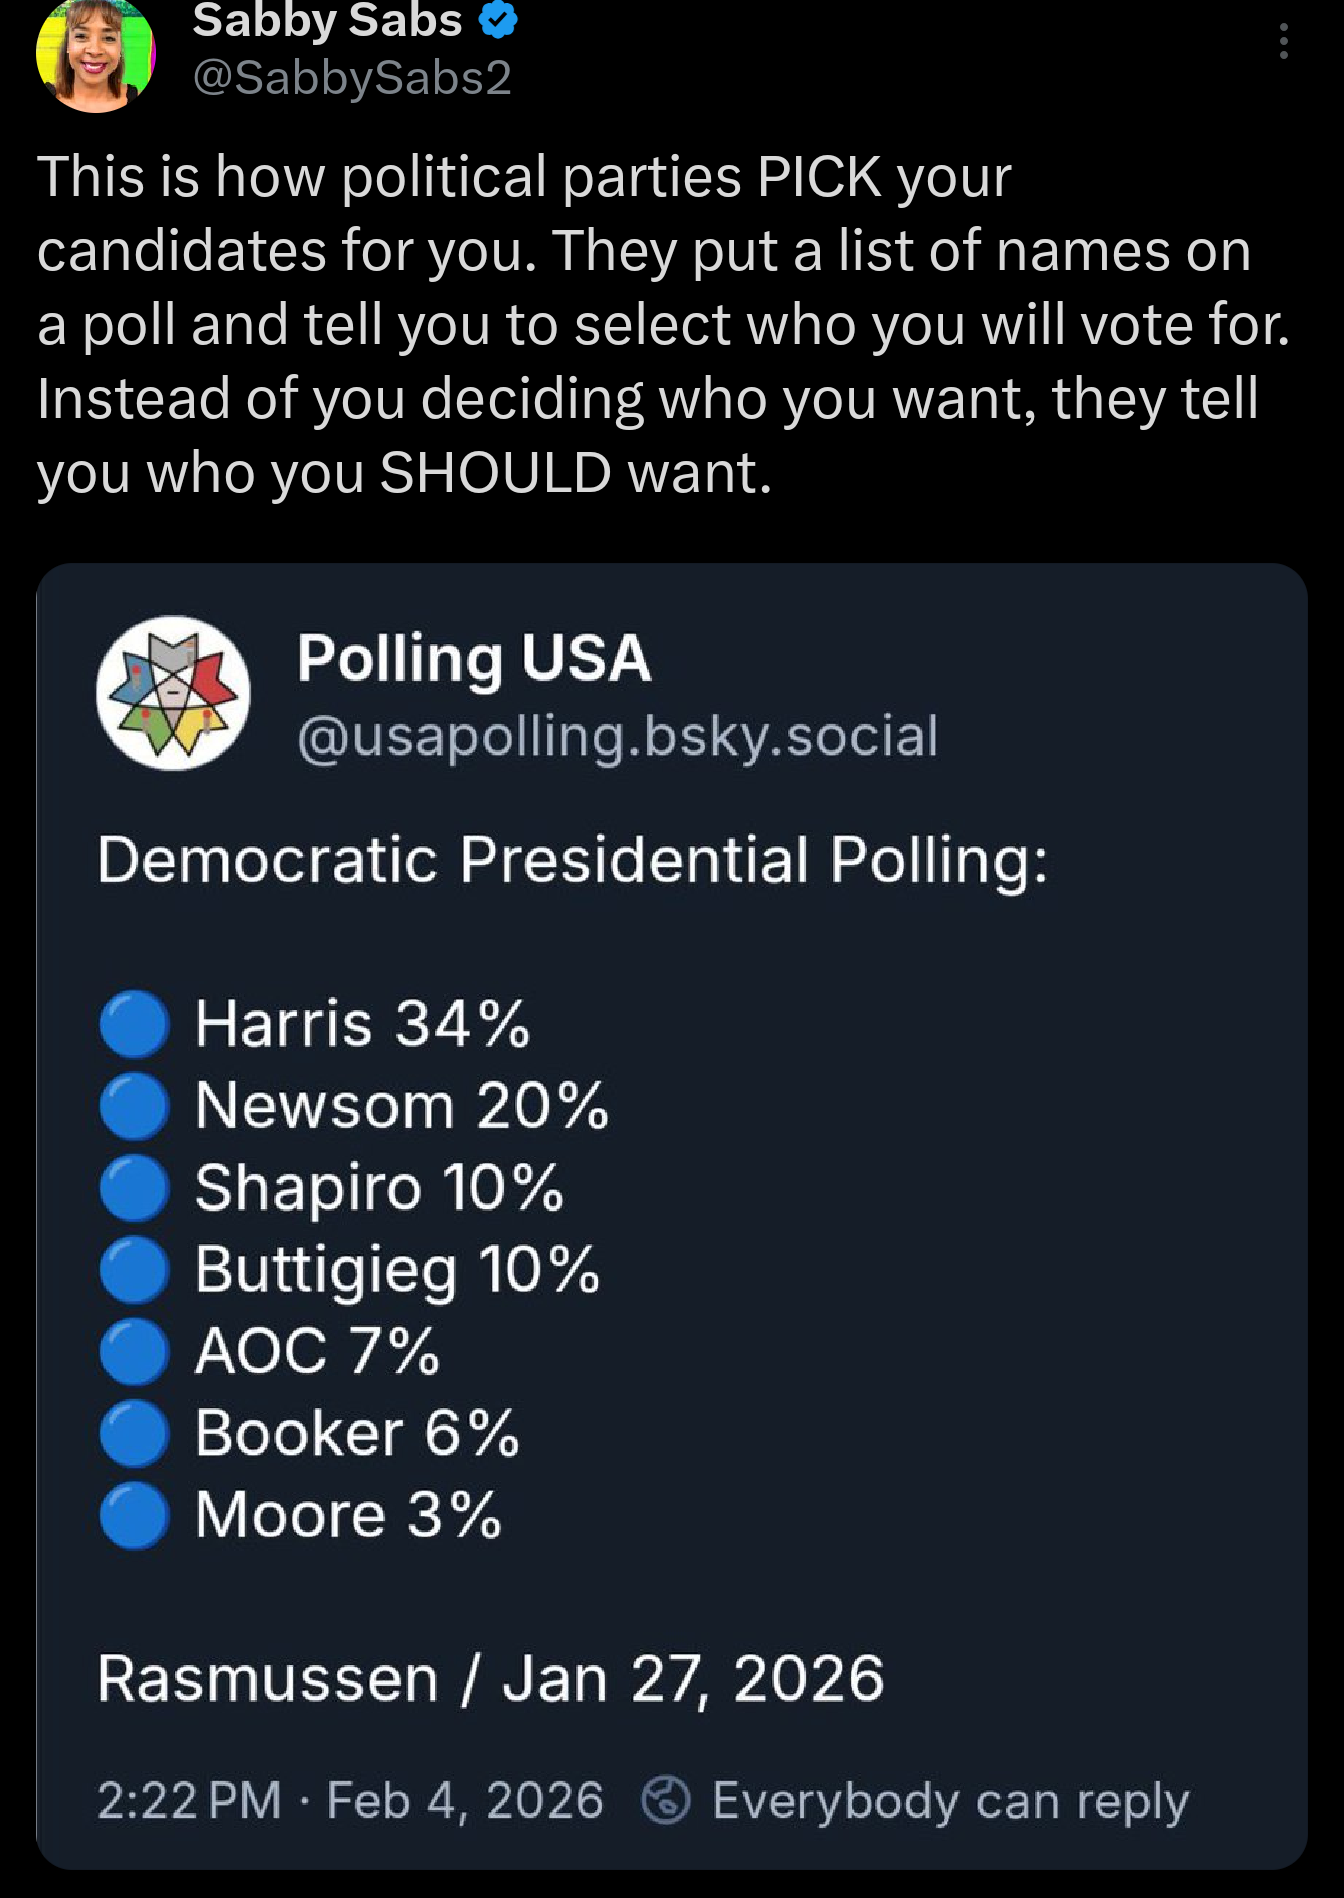
Those same ‘independent firms’ do manipulate data for the parties. This was a poll from 2016, the only way they could show Hillary beating Bernie is if they only polled her demographic. And any voter not looking at the methodology would be convinced that Hillary was truly beating Bernie and in turn vote for her.
To get the numbers they wanted, showing Hillary beating Bernie, they only polled Hillary’s demographic. They completely omitted polling the 18-49yo demographic to gaslight that the public wanted Hillary.
They polled them. I can make out under your line that “Under ?5” (presumably “55”) is 53-45 in favor of Sanders. But the smaller age breakdowns were too small.
Is this a deliberate avoidance of polling younger voters in order to boost Clinton? Or did they try polling evenly but their methodology is outdated and skewed older? Or are they getting an accurate sample of voters and the boomers are just vastly outnumbering everyone else? I don’t think the answer is clear.
But I feel like drawing your circle in a way that obscures the “Under ?5” demographic which did favor Sanders and then saying that they didn’t poll the demographic that favors Sanders comes off as shady. Like the pollsters, it’s not clear whether it’s deliberately misleading or a simple accident.
That was just how my finger traced it. Other polling from CNN before the primary season showed numbers for all age ranges with Bernie beating the hell out of Hillary. It wasn’t until after super Tuesday that the demographics polled start skewing towards Hillary. The part I was highlighting was no data polled from 18-49
I’d assume that somewhere later it explains what “N/A” and “*” mean here, but you can see that “Under 55” picks Sanders while “50-64” picks Clinton. So my guess is that “N/A” means that the size of that group is too small for them to have confidence in it. When they combine the two columns together, there’s enough (that’s why there’s data show in “Under 55”).
Like (I’m just making up numbers), maybe they determine that they need 100 respondents to have any statistical power. And they got 70 in the 18-34 group and 87 in the 35-49 group, but 103 in the 50-64 and 450 in the 65+.
You can see a hint of this in the sampling error, also: the larger number on 50-64 means that was the smallest of the groups shown. Meanwhile “55 and Older” is clearly a larger group than “Under 55”.
Probably, “*” means “no responses”. They don’t want to say “0%” because they know it’s not true that there are literally zero younger voters who had no opinion, but none of the people they surveyed answered that way. That’s another hint that the group is small.
Yes the devil’s in the detail, but there is no such thing as a survey without methods; and every method has its constants and assumptions. Yes, sometimes there are ulterior motives - but frequently it’s just lack of time, money, thematic tradeoffs, methodological complexity, etc.
This is why it’s good to have different mutually independent polling companies asking the same questions. They won’t perfectly align, but they will give a corridor of reasonable expectation.
This was only one example. If they were constraints like time or money there would still be some results from the 18-49 demographic. I had other samples from other polls during this time frame that used similar methodology to manipulate perception.
You’re probably right in this specific case; this seems suspiciously one-sided. Do you have a link to the source where they explain their methods?
Generally something like this can happen though, especially if you do e.g. random dialing on the landline to survey people; mostly older people still use landlines and mostly retired people actually pick up during office hours. A good social scientist would obviously try to measure and control for those sampling errors though, not make them on purpose to get pre-determined results.


Those same ‘independent firms’ do manipulate data for the parties. This was a poll from 2016, the only way they could show Hillary beating Bernie is if they only polled her demographic. And any voter not looking at the methodology would be convinced that Hillary was truly beating Bernie and in turn vote for her.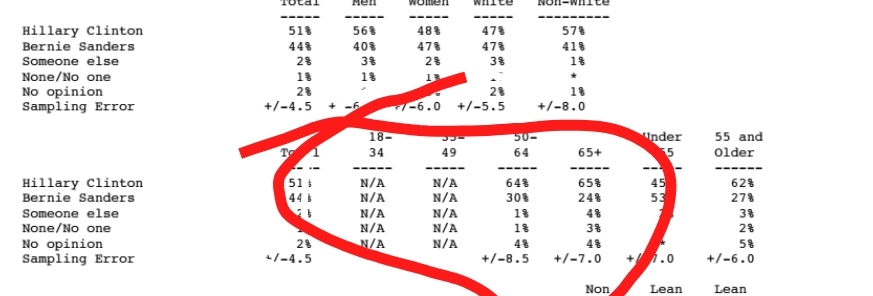
I’m not sure what you’re trying to show here? That younger voters preferred Sanders? That’s on there, but your red circle is mostly covering it.
To get the numbers they wanted, showing Hillary beating Bernie, they only polled Hillary’s demographic. They completely omitted polling the 18-49yo demographic to gaslight that the public wanted Hillary.
They polled them. I can make out under your line that “Under ?5” (presumably “55”) is 53-45 in favor of Sanders. But the smaller age breakdowns were too small.
Is this a deliberate avoidance of polling younger voters in order to boost Clinton? Or did they try polling evenly but their methodology is outdated and skewed older? Or are they getting an accurate sample of voters and the boomers are just vastly outnumbering everyone else? I don’t think the answer is clear.
But I feel like drawing your circle in a way that obscures the “Under ?5” demographic which did favor Sanders and then saying that they didn’t poll the demographic that favors Sanders comes off as shady. Like the pollsters, it’s not clear whether it’s deliberately misleading or a simple accident.
That was just how my finger traced it. Other polling from CNN before the primary season showed numbers for all age ranges with Bernie beating the hell out of Hillary. It wasn’t until after super Tuesday that the demographics polled start skewing towards Hillary. The part I was highlighting was no data polled from 18-49
Edit sp
I’d assume that somewhere later it explains what “N/A” and “*” mean here, but you can see that “Under 55” picks Sanders while “50-64” picks Clinton. So my guess is that “N/A” means that the size of that group is too small for them to have confidence in it. When they combine the two columns together, there’s enough (that’s why there’s data show in “Under 55”).
Like (I’m just making up numbers), maybe they determine that they need 100 respondents to have any statistical power. And they got 70 in the 18-34 group and 87 in the 35-49 group, but 103 in the 50-64 and 450 in the 65+.
You can see a hint of this in the sampling error, also: the larger number on 50-64 means that was the smallest of the groups shown. Meanwhile “55 and Older” is clearly a larger group than “Under 55”.
Probably, “*” means “no responses”. They don’t want to say “0%” because they know it’s not true that there are literally zero younger voters who had no opinion, but none of the people they surveyed answered that way. That’s another hint that the group is small.
Yes the devil’s in the detail, but there is no such thing as a survey without methods; and every method has its constants and assumptions. Yes, sometimes there are ulterior motives - but frequently it’s just lack of time, money, thematic tradeoffs, methodological complexity, etc.
This is why it’s good to have different mutually independent polling companies asking the same questions. They won’t perfectly align, but they will give a corridor of reasonable expectation.
This was only one example. If they were constraints like time or money there would still be some results from the 18-49 demographic. I had other samples from other polls during this time frame that used similar methodology to manipulate perception.
You’re probably right in this specific case; this seems suspiciously one-sided. Do you have a link to the source where they explain their methods?
Generally something like this can happen though, especially if you do e.g. random dialing on the landline to survey people; mostly older people still use landlines and mostly retired people actually pick up during office hours. A good social scientist would obviously try to measure and control for those sampling errors though, not make them on purpose to get pre-determined results.
I have the methods for this poll buried somewhere. I do remember it was a mix of landline/cell, in person, and mail.